The System Dashboard provides administrators with a snapshot of system data, including the status of service instances and terminals and schema differences. This data is view-only.
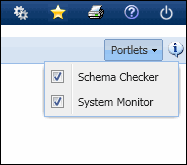
Use the Portlets drop-down list in the top right corner of the form to select a portlet to open. The portlets that you can view in the System Dashboard must be enabled in your Security Role. You can also change the columns that appear in a portlet by modifying them in your Form Profile.
See Also:
Use the Portlets drop-down list at top of screen to select a portlet to open.
Check the box to display (open) a portlet. Uncheck the box to close the portlet.

The individual portlets resize horizontally according to the amount of data being shown. You cannot manually resize the portlets horizontally.
You can drag the bottom of a portlet to resize it vertically.
You can also use the ![]() buttons in the top right corner of the portlet to minimize and maximize
the window.
buttons in the top right corner of the portlet to minimize and maximize
the window.
To minimize a portlet, click the minimize ![]() button. Only the title bar will appear.
button. Only the title bar will appear.
Click the ![]() button to return
the portlet to its previous size.
button to return
the portlet to its previous size.
To maximize a portlet, click the ![]() button. When the portlet is maximized, click the
button. When the portlet is maximized, click the ![]() button to restore it to its previous size.
button to restore it to its previous size.
Click the ![]() button to close
the portlet, or uncheck the portlet in the Portlets drop-down list. To
open the portlet again, check the box next to it in the Portlets drop-down
list.
button to close
the portlet, or uncheck the portlet in the Portlets drop-down list. To
open the portlet again, check the box next to it in the Portlets drop-down
list.
The Schema Checker portlet will provide details as to which database objects have caused the database and application schemas to be different. This information can also be viewed in the Schema Checker form.
The differences shown in the Schema Checker portlet will be organized into a Category (Table, Column, Primary Key, Unique Constraint, Index, Foreign Key, Sequence, Trigger, Procedure, or View). The # Differences column will show the number of differences between the application and database schemas for a specific Category.
The differences that are shown in this form will be color coded.
Green indicates no differences between the database and application schema.
Yellow indicates there are extra items (such as extra tables) in the database schema that are not in the application schema. Note that extra columns will appear in red as they are changes to an existing table.
Red is used for any other differences between the database and application schema (such as missing keys in the database).
If a Category has any differences, click the row to display a pop-up window with a detailed list of these differences. Click Download to save the records in this pop-up form to a .csv file.
The System Monitor portlet displays the status of your service instances and terminals.
Services Status indicates whether any service instances have an error status. If any of the services have a Status of Error, a red light will appear If none of the services have a Status of Error, a green light will appear.
Terminal Status shows whether any active terminals are online or offline. If an active terminal is offline, the Terminals Status will display a red light. If none of the active terminals are offline, the Terminal Status will display a green light.