Use the Consultant Progress chart to view how each consultant's JTD is trending compared to the remaining work on the project. This information is presented at the WBS level, and updates as you select different levels on the Consultants Planning grid. Use this information to quickly analyze each consultant's progress and form comparisons against other consultants. You can hover over or tap a bar on the chart to see specific amounts.
Contents
The amounts on this chart display at billing or cost, depending on the budget type (Billing, Cost, or Cost and Billing). After you specify the budget type, there are
Billing and/or Cost options that display on the Planning page to indicate the type of amount that you are viewing. The chart's criteria, amounts, title, and heading color also reflect the selection. If both
Billing and Cost options display, you can switch between them and the chart's information will update accordingly.
See the Switch Consultant Amounts from Billing to Cost online help topic for more information.
If your firm uses Vision Multicurrency, the currency in use is indicated next to the
Billing
and
Cost options. For example,
Billing (USD)
displays if you are viewing the plan at billing and in U.S. dollars. The Project Currency is always used when viewing projects and plans at cost. The currency used when viewing projects and plans at billing is determined by a Vision Configuration setting that your system administrator selects. See the Use Project and Billing Currencies online help topic for more information on currencies.
| Field | Description |
|---|
| Consultant Name or Type
|
The consultant names and/or consultant types display on the left side of the chart, with an associated progress bar for each. The consultant name displays when it is associated with a planned amount or JTD charges to direct or reimbursable consultant accounts. The consultant type displays for any consultant account types that do not have associated consultant names. The consultant types are grouped below the consultant names.
|
| Consultant Progress Bars
|
The JTD and ETC bars display what percent of the total planned amount is complete through today, and what percent of the planned amount remains for each consultant type.
JTD % = (JTD/(ETC + JTD)) * 100
ETC % = (ETC/(ETC + JTD)) * 100
The JTD amount is the sum of all consultant-related charges on posted transactions and committed purchase orders through today. For consultant names, it is the sum of all charges for the name. When no name is assigned, though, it is the sum of all charges for the account that displays for the consultant type.
Calculation of the ETC amount depends on whether the project plan is a Navigator plan or a Vision plan:
- Navigator plan: If Planned consultants - JTD consultants is greater than 0, then ETC consultants = Planned consultants - JTD consultants. If Planned consultants - JTD consultants is less than or equal to 0, then ETC consultants = 0.
- Vision plan: ETC consultants = Sum of planned consultants from tomorrow forward.
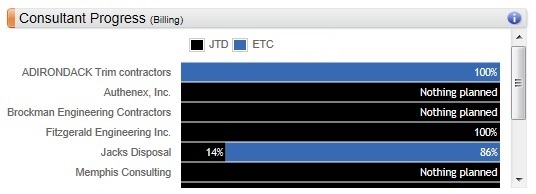
You can view a summary of the percentages for each consultant. For example, on the following project, Jacks Disposal is 14% complete.
You can also hover over each consultant's progress bar to view a summary of the amounts. For example, when you hover over Jacks Disposal, the respective JTD, ETC, EAC, and planned amounts and calculations display.
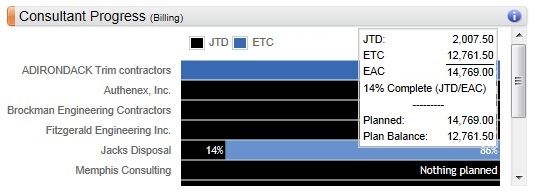
If the JTD is greater than the planned amount, the
Plan Balance field displays in red to alert you that the project is trending to be over budget.
If there is JTD but no planned amount, the bar displays
Nothing planned.
|