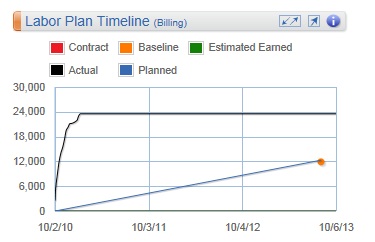
The Labor Plan Timeline chart on the Labor planning page displays the cumulative baseline, planned, and actual labor amounts for each WBS element, as well as the estimated earned amount over the life of the project. Use this chart to analyze the accuracy of forecasts and to improve future planning efforts.
The periods that can display on the chart reflect the selected WBS element's date range. As you select a project, phase, or task on the labor planning grid, the amounts on the chart update to reflect the data for that WBS row.
Contents
As you review the chart, you can mouse over or tap on its data points to view specific amounts. If the project has a Navigator plan, the data points are based on the calendar scale assigned in Plan Settings. The earliest and latest dates on the chart update based on the earliest and latest planned, baseline, and JTD activity. If the date range for the selected WBS element on a Vision plan is 0 to 180 days, the data points are weekly; if the range is greater than 180 days, the data points are monthly.
The chart displays edits to the plan when the edits are saved.
The amounts on this chart display at billing or cost, depending on the budget type (Billing, Cost, or Cost and Billing). After you specify the budget type, there are
Billing and/or Cost options that display on the Planning page to indicate the type of amount that you are viewing. The chart's criteria, amounts, title, and heading color also reflect the selection. If both
Billing and Cost options display, you can switch between them and the chart's information will update accordingly.
See the Switch Consultant Amounts from Billing to Cost online help topic for more information.
If your firm uses Vision Multicurrency, the currency in use is indicated next to the
Billing
and
Cost options. For example,
Billing (USD)
displays if you are viewing the plan at billing and in U.S. dollars. The Project Currency is always used when viewing projects and plans at cost. The currency used when viewing projects and plans at billing is determined by a Vision Configuration setting that your system administrator selects. See the Use Project and Billing Currencies online help topic for more information on currencies.
Note: The Accounting tab in
determines your access rights to labor costs rates and amounts in Navigator. When you select the Cost option, some information may not display because of your security access. See the Security Settings and Labor Cost Amounts online help topic for more information.
If a project is mapped on multiple Vision plans and the Include in utilization and project reports option is selected, the Baseline, Planned, and EAC lines are a combined total. The Estimated Earned line may also be a combined total if the percent complete formula is one of the following: (Planned - Estimate-to-Complete)/Planned or (Baseline - Estimate-to-Complete)/Baseline. Actual and contract lines are not combined.
| Field | Description |
|---|
| Contract (displays when the Billing option is selected)
|
This line represents the labor contract billing amount from the Contract planning grid. This amount displays at the billing currency used in Navigator.
|
| Baseline
|
This line represents the selected WBS row's planned labor billing or cost amount that is saved in the baseline.
|
| Planned
|
This line represents the selected WBS row's planned labor billing or cost amount through today's date.
Calculation: Planned = Planned labor amount at billing through today
|
| Actual
|
This line represents the selected WBS row's billing or cost amount of the posted plus unposted labor charges through today's date.
|
| Estimated Earned
|
This line represents the WBS row's contract earned billing or cost amount based on the Percent Complete Formula for the plan. Plans managed in Navigator use the following Percent Complete Formula:
Job-to-Date/(Job-to-Date + Estimate to Complete)
Plans managed in Vision allow the user to set the Percent Complete Formulas. The formulas that impact the Estimated Earned in Navigator are as follows:
- (Planned - Estimate-to-Complete)/Planned
- Job-to-Date/(Job-to-Date + Estimate-to-Complete)
- (Baseline - Estimate-to-Complete)/Baseline
The
Estimated Earned
calculations differ depending on the assigned Budget Type: Billing or Cost.
- Estimated Earned at Billing: The percent complete is calculated for each period. This percent is then multiplied by the contract for the selected WBS element to determine an estimated amount of the contract that would be earned for the period.
- Estimated Earned at Cost: The percent complete is calculated for each period. This percent is then multiplied by the contract for the selected WBS element and divided by the target multiplier to determine an estimated cost amount that would be earned for the period, which serves as a good comparison to the other cost amounts.
If plans are managed in Vision and the project is mapped on multiple Vision plans, Navigator applies the
Percent Complete Formula from the plan with the earliest creation date that has the
Include in utilization and project reports
option selected.
The
Estimated Earned line does not display in the following situations:
- If the Percent Complete Formula on the Vision plan is set to User Entered.
- If the Percent Complete Formula is set to (Baseline - Estimate to Complete)/Baseline but there is no baseline
- If there is no planned data
- If there is no JTD + ETC data
|
| Tooltips
|
Tooltips display when you hover over or tap various parts of the Navigator interface, including buttons, status and warning indicators, and data on the dashparts and charts. You can also click the
 buttons to view specific calculation information, and click the
More links to access the pertinent Navigator online help. buttons to view specific calculation information, and click the
More links to access the pertinent Navigator online help.
If you are using a tablet device, the tooltip hover action is not available, but you can tap the
buttons and
More links to view the calculations and online help.
|
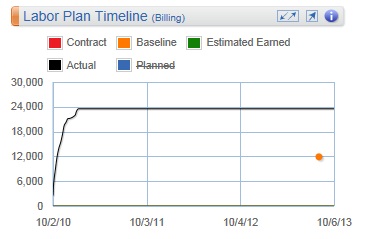
You can turn chart lines on and off. Click a line name in the chart legend to turn the chart line on or off.