The Project Management charts display when you select the contract, labor, expense, or consultant pages. These charts provide details on amounts based on the selected WBS element on the grid.
For example, following are the Labor Plan Summary and Labor Plan Timeline charts. These charts display when you select the Labor page. As you update information on the Labor grid, the data on these charts updates to reflect the selected row.
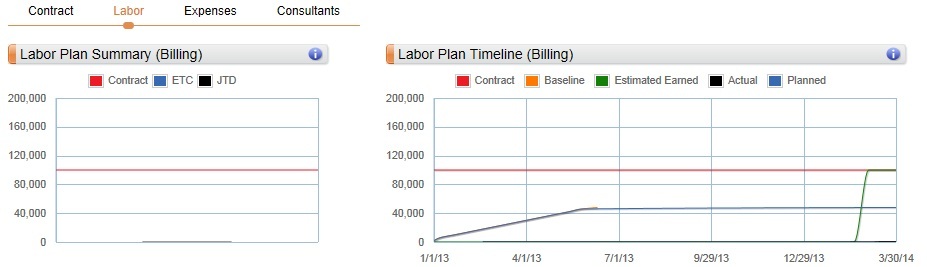
Standard behaviors of Navigator charts include:
- You can click any label with a dotted line to view additional details and access the related online help topic.
- The periods that can display on the chart reflect the selected WBS element's date range. As you select a project, phase, or task on the labor planning grid, the amounts on the chart update to reflect the data for that WBS row.
- For most charts, you can mouse over or tap on the data points to view specific amounts. If the project has a Navigator plan, the data points are based on the calendar scale assigned in Plan Settings. If the date range for the selected WBS element on a Vision plan is 0 to 180 days, the data points are weekly; if the range is greater than 180 days, the data points are monthly.
- Depending on if you are viewing the plan at cost or at billing, different information and amounts may display on the charts. See the individual dashpart and chart online help topics for more information.